Category:Graphics from the UNESCO Science Report, towards 2030, Chapter 16, Israel
Jump to navigation
Jump to search

Media in category "Graphics from the UNESCO Science Report, towards 2030, Chapter 16, Israel"
The following 15 files are in this category, out of 15 total.
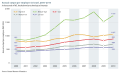 Annual output per employee in Israel, 2000–2010.svg 644 × 398; 1.28 MB
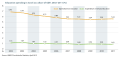 Education spending in Israel as a share of GDP, 2002–2011.svg 647 × 313; 207 KB
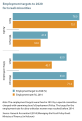 Employment targets to 2020 for Israeli minorities.svg 312 × 458; 1.39 MB
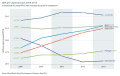 GDP per capita in Israel, 2009–2013.svg 644 × 407; 1.64 MB
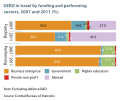 GERD in Israel by funding and performing sectors, 2007 and 2011.svg 313 × 263; 1.25 MB
 GERD in Israel by type of research, 2006 and 2013.svg 305 × 477; 955 KB
 Israeli patent applications filed with USPTO, 2002–2012.svg 647 × 456; 683 KB
 Trends in Israel’s GERD GDP ratio, 2006–2013.svg 642 × 499; 958 KB
 Venture capital raised by Israeli funds, 2013 Per thousand units of GDP.svg 647 × 465; 1.16 MB


_and_senior_academic_staff_(2011).svg)