File:2015 Pacific typhoon season summary.png
Jump to navigation
Jump to search
(newest | oldest) View (newer 10 | older 10) (10 | 20 | 50 | 100 | 250 | 500)


Size of this preview: 800 × 600 pixels. Other resolutions: 320 × 240 pixels | 640 × 480 pixels | 1,024 × 768 pixels | 1,280 × 960 pixels | 4,000 × 3,000 pixels.
Original file (4,000 × 3,000 pixels, file size: 7.77 MB, MIME type: image/png)
Captions
Add a one-line explanation of what this file represents
Captions
Summary[edit]
| Description |
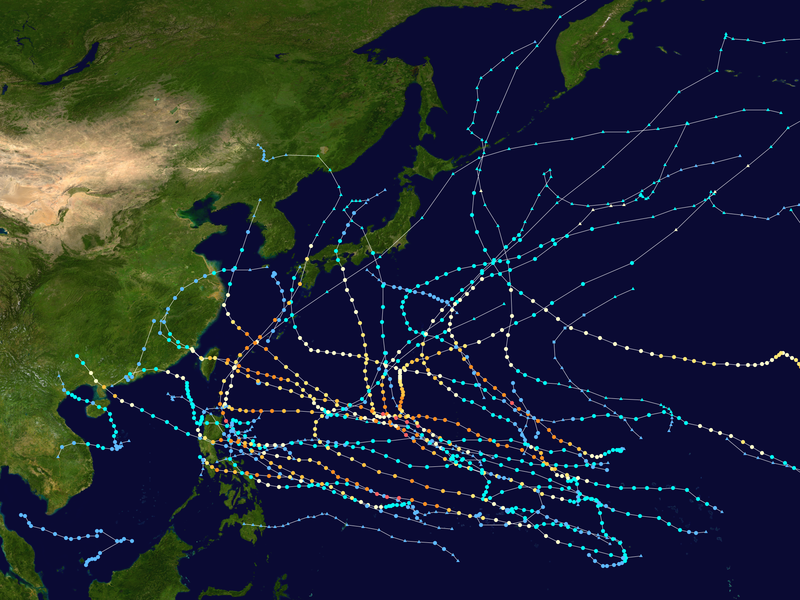
English: This map shows the tracks of all tropical cyclones in the 2015 Pacific typhoon season. The points show the location of each storm at 6-hour intervals. The colour represents the storm's maximum sustained wind speeds as classified in the Saffir-Simpson Hurricane Scale (see below), and the shape of the data points represent the type of the storm.
|
|||||||||||||||||||||||||||||||||||||||||||||||||||||||
| Date | January 1–December 23 | |||||||||||||||||||||||||||||||||||||||||||||||||||||||
| Source | Created using WikiProject Tropical cyclones/Tracks. The background image is from NASA [1]. The tracking data is from the Joint Typhoon Warning Center's best track database | |||||||||||||||||||||||||||||||||||||||||||||||||||||||
| Author | Keith Edkins | |||||||||||||||||||||||||||||||||||||||||||||||||||||||
Licensing:[edit]
| This work has been released into the public domain by its author, Keith Edkins. This applies worldwide. In some countries this may not be legally possible; if so: Keith Edkins grants anyone the right to use this work for any purpose, without any conditions, unless such conditions are required by law. |
File history
Click on a date/time to view the file as it appeared at that time.
(newest | oldest) View (newer 10 | older 10) (10 | 20 | 50 | 100 | 250 | 500)
| Date/Time | Thumbnail | Dimensions | User | Comment | |
|---|---|---|---|---|---|
| current | 02:48, 29 February 2020 | | 4,000 × 3,000 (7.77 MB) | Supportstorm (talk | contribs) | Primarily JTWC/JMA data |
| 05:28, 9 December 2018 |  | 4,000 × 3,530 (11.28 MB) | Supportstorm (talk | contribs) | Reverted to version as of 04:05, 11 October 2016 (UTC) | |
| 04:32, 28 August 2018 |  | 4,000 × 3,000 (10.04 MB) | David Petrovsky (talk | contribs) | Added the dimensions and size both | |
| 04:05, 11 October 2016 |  | 4,000 × 3,530 (11.28 MB) | Supportstorm (talk | contribs) | Fixed 12W | |
| 04:01, 11 October 2016 |  | 4,000 × 3,530 (11.29 MB) | Supportstorm (talk | contribs) | Best tracks/ operational JMA TD data | |
| 16:43, 1 January 2016 |  | 4,000 × 3,460 (10.91 MB) | Supportstorm (talk | contribs) | Update | |
| 17:00, 26 November 2015 |  | 4,000 × 3,460 (10.88 MB) | Supportstorm (talk | contribs) | Update | |
| 03:41, 17 October 2015 |  | 4,000 × 3,540 (12.74 MB) | Cyclonebiskit (talk | contribs) | Update (don't forget to change the line size "lines --0.04") | |
| 05:43, 8 October 2015 |  | 4,000 × 3,460 (10.78 MB) | Supportstorm (talk | contribs) | Update | |
| 16:47, 28 September 2015 |  | 4,000 × 3,540 (12.66 MB) | Cyclonebiskit (talk | contribs) | update, bump res to 4k |
You cannot overwrite this file.
File usage on Commons
The following 20 pages use this file:
- User:OgreBot/Uploads by new users/2018 August 28 04:30
- Commons:Overwriting existing files
- Commons:Overwriting existing files/ar
- Commons:Overwriting existing files/cs
- Commons:Overwriting existing files/da
- Commons:Overwriting existing files/de
- Commons:Overwriting existing files/en
- Commons:Overwriting existing files/en-ca
- Commons:Overwriting existing files/es
- Commons:Overwriting existing files/fa
- Commons:Overwriting existing files/fr
- Commons:Overwriting existing files/id
- Commons:Overwriting existing files/ja
- Commons:Overwriting existing files/kn
- Commons:Overwriting existing files/pl
- Commons:Overwriting existing files/pt
- Commons:Overwriting existing files/pt-br
- Commons:Overwriting existing files/ru
- Commons:Overwriting existing files/uk
- Commons:Overwriting existing files/zh
File usage on other wikis
The following other wikis use this file:
- Usage on ar.wikipedia.org
- Usage on de.wikipedia.org
- Usage on en.wikipedia.org
- Pacific typhoon season
- 2015 Pacific typhoon season
- User:Hamham31/sandbox
- User:Typhoon2013/2015 Pacific typhoon season
- Template:2015 Pacific typhoon season buttons
- Timeline of the 2015 Pacific typhoon season
- Tropical Storm Mekkhala (2015)
- Typhoon Maysak (2015)
- Typhoon Noul (2015)
- Typhoon Dolphin (2015)
- User:Nino Marakot/2015 Pacific typhoon season
- Typhoon Chan-hom (2015)
- Tropical Storm Linfa (2015)
- Typhoon Nangka (2015)
- Typhoon Halola
- Typhoon Soudelor
- Tropical Storm Bavi (2015)
- Typhoon Goni (2015)
- Tropical Storm Etau (2015)
- Typhoon Dujuan (2015)
- Typhoon Mujigae
- Typhoon Koppu
- Tropical Storm Vamco (2015)
- Typhoon Melor
- User:Tfmbty/2015 Pacific typhoon season
- Usage on es.wikipedia.org
- Usage on fr.wikipedia.org
- Usage on ja.wikipedia.org
- Usage on ko.wikipedia.org
- Usage on nl.wikipedia.org
- Usage on th.wikipedia.org
- Usage on vi.wikipedia.org
- Usage on zh-yue.wikipedia.org
- Usage on zh.wikipedia.org
View more global usage of this file.