Category:Molecular electrical potential surfaces
Jump to navigation
Jump to search

See also Category:Molecular orbitals
Media in category "Molecular electrical potential surfaces"
The following 68 files are in this category, out of 68 total.
-Thalidomide_model_TSC.png/120px-(R)-Thalidomide_model_TSC.png) (R)-Thalidomide model TSC.png 4,097 × 2,357; 1.15 MB
(R)-Thalidomide model TSC.png 4,097 × 2,357; 1.15 MB
-Thalidomide_model_TSC.png/120px-(S)-Thalidomide_model_TSC.png) (S)-Thalidomide model TSC.png 3,359 × 1,852; 1.14 MB
(S)-Thalidomide model TSC.png 3,359 × 1,852; 1.14 MB
 1FIW ESP Map.png 4,418 × 2,862; 7.07 MB
 6-APA Mulliken charges surface.gif 815 × 675; 6.18 MB
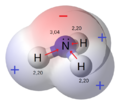
 Ammonia-elpot-transparent-3D-balls-A.png 1,073 × 1,100; 275 KB
 Ammonia-elpot-transparent-3D-balls-B.png 1,100 × 964; 265 KB
 Ampicillin total charge surface.gif 805 × 965; 6.95 MB
 Benzene Electrostatics.jpg 460 × 472; 37 KB
 Benzene-3D-potential.png 753 × 768; 224 KB
 Bifluoride-elpot-3D-vdW.png 1,029 × 600; 130 KB
 Borazine-elpot-3D-vdW.png 725 × 748; 238 KB
 Boron-trifluoride-elpot-3D-vdW.png 1,100 × 1,032; 306 KB
 Bupropion 3D structure with electrostatic potential.png 1,168 × 873; 703 KB
 Caffeine total charge surface.gif 757 × 733; 6.47 MB
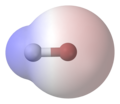
 Carbon-monoxide-elpot.png 914 × 711; 215 KB
 Chlorine-dioxide-elpot.png 1,100 × 847; 374 KB
 Chlorine-trifluoride-elpot.png 1,100 × 865; 364 KB
 Cinnamaldehyde-3D-elpot.png 1,022 × 687; 280 KB
- Common-Force-Field-Thermodynamics-of-Cholesterol-207287.f1.ogv 14 s, 720 × 768; 2.39 MB
 Cyclooctatetraenide-elpot-3D-vdW.png 796 × 758; 256 KB
 Cyclopentadienide-elpot-3D-vdW.png 769 × 761; 147 KB
 D-Ala-D-ala total charge surface.gif 632 × 737; 5.47 MB
 Delphi-Peptide.png 1,111 × 787; 358 KB
 Diagram of zeta potential and slipping plane.svg 3,611 × 3,033; 513 KB
 Dipoli acido fluoridrico.png 747 × 600; 140 KB
 Dipoli acqua.png 712 × 599; 158 KB
 Dipoli ammoniaca.png 684 × 599; 164 KB
 DMSO-elpot.png 1,100 × 964; 426 KB
 Electrostatic potential heterocycles.tif 648 × 288; 1.15 MB
 Electrostatic potential map benzyne.jpg 201 × 119; 10 KB
 Electrostatic Potential.jpg 439 × 110; 8 KB
 HX-polarity-montage-3D-balls-horizontal.png 2,150 × 602; 255 KB
 HX-polarity-montage-3D-balls.png 823 × 2,200; 340 KB
 Hydrogen-astatide-elpot-transparent-3D-balls.svg 1,125 × 995; 11 KB
 Hydrogen-bromide-elpot-transparent-3D-balls.png 1,100 × 952; 177 KB
 Hydrogen-chloride-elpot-transparent-3D-balls.png 1,100 × 936; 180 KB
 Hydrogen-fluoride-elpot-transparent-3D-balls.png 1,100 × 883; 182 KB
 Hydrogen-iodide-elpot-transparent-3D-balls.png 1,100 × 972; 178 KB
 Hydrogen-sulfide-elpot-transparent-3D-balls.png 1,100 × 1,038; 247 KB
 Hydroxonium-3D-elpot.png 734 × 729; 202 KB
- Induced-Fit-in-Protein-Multimerization-The-HFBI-Case-pcbi.1005202.s005.ogv 4.0 s, 1,412 × 1,030; 3.57 MB
 Lawesson's-reagent-elpot-3D-balls.png 1,100 × 616; 366 KB
 Lithium-fluoride-elpot-3D-balls.png 1,100 × 780; 150 KB
 Nanocar electrostatic potential.jpg 4,000 × 2,445; 2.38 MB
 Nitrate-ion-elpot.png 751 × 714; 304 KB
 Nitrobenzoic acid.png 464 × 326; 101 KB
 Ozone-elpot-3D-vdW.png 994 × 758; 183 KB
 Paracetamol Electron Map.png 1,072 × 1,000; 160 KB
 Penicillin G Electrostatic Surfaces.jpg 586 × 487; 158 KB
 Phenol-elpot-3D-vdW.png 663 × 752; 195 KB
 Phenol-elpot.png 514 × 729; 125 KB
 Phosphine-elpot-transparent-3D-balls.png 1,100 × 1,082; 248 KB
 Phosphoric-acid-potential.png 928 × 1,000; 284 KB
 Serotonin Electron Map.tiff 1,184 × 994; 275 KB
 Simvastatin with electrostatic potential mapped to molecular surface.png 816 × 840; 256 KB
 Sulfur-dioxide-elpot.png 831 × 668; 285 KB
 Taxol total charge surface.gif 796 × 697; 19.8 MB
 Theobromine total charge surface.gif 986 × 974; 8.47 MB
 Thiocyanate-elpot.png 1,071 × 724; 340 KB
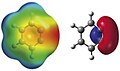
 Toluene-potential-upside-down.png 882 × 1,100; 413 KB
 Toluene-potential.png 882 × 1,100; 435 KB
 Trichloroacetic-acid-elpot.png 763 × 700; 149 KB
 Trifluoroacetic-acid-elpot.png 700 × 639; 223 KB
 Trioxidane-elpot-transparent-3D-balls.png 790 × 590; 98 KB
 Water-elpot-transparent-3D-balls.png 1,100 × 926; 236 KB
.png/120px-Флуорохелиат_(облак).png) Флуорохелиат (облак).png 1,276 × 875; 152 KB
Флуорохелиат (облак).png 1,276 × 875; 152 KB
.png/120px-Флуорохелиева_киселина_(облак).png) Флуорохелиева киселина (облак).png 1,276 × 875; 179 KB
Флуорохелиева киселина (облак).png 1,276 × 875; 179 KB
-Thalidomide_model_TSC.png)
-Thalidomide_model_TSC.png)


.jpg)


.png)
.png)